
 EN
EN

Independent store sellers often hit a predictable plateau: acquisition still costs money, traffic still arrives, but unit economics flatten because single-item orders cannot absorb handling, packaging, and last-mile variability. The second growth curve usually does not come from louder promotion, but from smarter offer architecture built from operational evidence. In practice, that means using fulfillment data to uncover what customers already buy together, where delivery friction appears, and which product pairings reduce hidden cost leakage. When bundle design is derived from fulfillment data instead of intuition, sellers can raise average order value while also stabilizing service quality.
This approach is especially useful for independent operators with limited headcount and tight cash cycles. They need bundle logic that can be implemented quickly, tested weekly, and improved without complex tooling. The fastest path is to reverse-engineer product bundles from fulfillment data patterns such as co-ship frequency, damage incidence, delivery zone performance, and return reason distribution. The result is a repeatable system where each bundle decision is grounded in operational reality rather than short-term guesswork.
Understanding the second-curve shift in independent commerce
Moving from traffic growth to order-quality growth
Early-stage growth normally comes from finding channel traction, improving creative, and fixing conversion basics. Once those gains mature, the next step is not just more orders, but better orders with stronger contribution margins. That transition defines the second curve, and fulfillment data becomes the core decision asset because it reveals whether each order structure is truly profitable after delivery complexity. Sellers who ignore fulfillment data often scale volume while quietly scaling friction and post-purchase cost.
Order-quality growth requires seeing beyond checkout totals. Two carts with similar revenue can carry very different downstream burdens depending on packaging constraints, pick complexity, and destination variability. Fulfillment data exposes those differences at the SKU-combination level, making it possible to redesign offers for operational fit. This is why second-curve growth is less about catalog expansion and more about engineered bundle architecture.
Why single-SKU optimization stalls faster than expected
Single-product optimization reaches a ceiling because every marginal conversion gain competes with increasing logistics noise. As order volume rises, minor inefficiencies in carton selection, dimensional weight, and exception handling create compound margin pressure. Fulfillment data helps isolate where those pressures start, which customer segments trigger them, and which item combinations reduce them. Without fulfillment data, teams may misread margin decline as an ad issue when the actual cause sits in downstream execution.
Independent sellers also face tighter tolerance for mistakes because they cannot spread losses across massive portfolios. A bundle strategy informed by fulfillment data gives them a practical buffer by improving order economics per shipment. It also creates a clearer planning rhythm: detect friction, redesign pairing logic, test, and refine. This cadence supports sustainable growth instead of short-lived campaign spikes.
Building a usable fulfillment data foundation for bundle decisions
Standardizing order-level fields before analysis
The most common failure in bundle analysis is inconsistent data structure across platforms, carriers, and warehouse exports. Before modeling bundle opportunities, sellers need one reliable schema for order ID, SKU mix, item quantity, pick timestamp, ship timestamp, packaging type, destination zone, and return outcome. Clean fulfillment data allows precise comparison between item combinations instead of noisy averages. Even a lightweight spreadsheet model can produce strong insights if field definitions remain stable.
Normalization should include time windows so seasonality does not distort interpretation. Comparing last week against the same weekday mix, similar promotion intensity, and similar dispatch cutoffs keeps fulfillment data meaningful. This discipline prevents overreaction to one-off disruptions and helps sellers identify persistent co-ship and exception patterns. A stable input layer is what makes reverse-engineered bundle design trustworthy.
Capturing friction signals that directly affect bundle viability
Not all operational fields are equally useful for bundle design. The highest-value fulfillment data signals are co-occurrence rate, split-shipment frequency, packing time variance, delivery delay incidence, damage/defect return codes, and refund resolution cost. These signals show whether a potential bundle is operationally coherent or likely to create hidden service burden. A bundle that looks attractive in merchandising terms but performs poorly in fulfillment data should be redesigned before scaling.
It is also important to segment fulfillment data by order destination and service tier. Some combinations work well in dense metro zones but break margin assumptions in remote delivery lanes. By examining fulfillment data at segment level, sellers can launch bundles with clear eligibility rules rather than one-size-fits-all exposure. That precision protects customer experience while improving gross contribution consistency.
Reverse-engineering bundle design from fulfillment behavior
Finding natural co-fulfillment clusters instead of forced pairings
The best bundles usually already exist in customer behavior as recurring fulfillment patterns. Start by ranking SKU pairs and trios by co-ship frequency, then overlay handling time and exception rates from fulfillment data. High co-ship plus low exception tendency is a strong cluster candidate, especially when packaging remains within stable dimensional thresholds. This method turns fulfillment data into a practical map of bundle-ready combinations.
Once candidates are identified, evaluate bundle coherence through operational and customer lenses at the same time. Operationally, fulfillment data should confirm lower split rates and manageable pack workflows. Commercially, the bundle should express a clear use case rather than an arbitrary discount. When both conditions align, conversion lift and post-purchase performance reinforce each other.
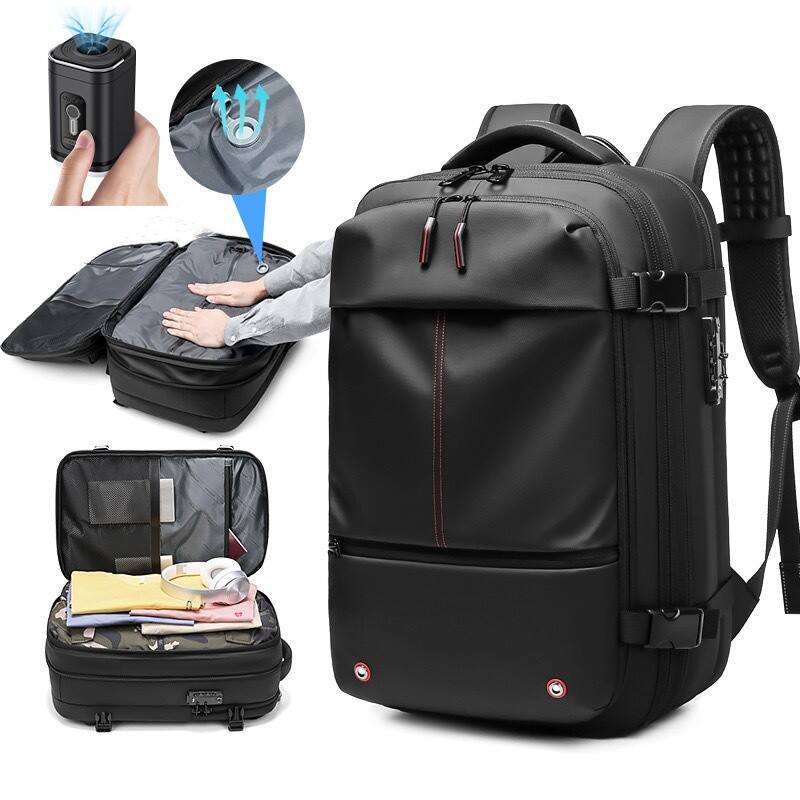
For travel-oriented assortment lines, lightweight compression categories often demonstrate strong co-ship behavior with accessory add-ons. In those cases, sellers can frame bundle logic around trip preparation outcomes while validating feasibility through fulfillment data. A practical reference point is fulfillment data tied to packaging dimensions, return reasons, and destination-zone performance, which helps avoid overbuilt bundle structures that increase handling complexity.
Translating exception patterns into explicit bundle rules
High-performing sellers do not treat exceptions as noise; they treat them as design constraints. If fulfillment data shows recurring damage for a specific combination under a certain carton type, bundle logic should include protective configuration or exclusion criteria. If fulfillment data shows delayed handoff in a destination segment, delivery promise language should be adapted for that bundle route. These rule-based adjustments convert operational learning into scalable offer governance.
Return reason text can be especially valuable when coded into consistent categories. When fulfillment data indicates mismatch expectations in multi-item orders, bundle page messaging should be clarified to reduce interpretive risk. When it indicates sizing or compatibility confusion, include explicit fit guidance inside the bundle detail copy. The bundle becomes stronger not because it is cheaper, but because it is operationally and informationally precise.
Running weekly test loops to scale bundle performance safely
Designing controlled pilots with measurable operational outcomes
Second-curve execution works best in short, disciplined cycles. Launch each new bundle to a controlled traffic share, then compare contribution margin, ticket value, pack time, and support contact rate against a baseline set. Fulfillment data should be reviewed on a rolling weekly cadence so adjustments happen before friction compounds. This prevents a promising bundle from becoming expensive due to unnoticed downstream drift.
A useful test frame includes one primary bundle hypothesis and one guardrail hypothesis. The primary hypothesis targets commercial gain, while the guardrail checks service stability using fulfillment data thresholds such as split rate and delivery delay. If commercial lift appears while guardrails deteriorate, revise construction before scaling exposure. This keeps growth quality aligned with operational capacity.
Closing the loop between warehouse feedback and storefront logic
Warehouse teams see bundle friction earlier than dashboards because they experience it in real handling time and exception queues. Their observations should be codified back into fulfillment data notes and linked to specific SKU combinations. That feedback can drive quick updates to bundle composition, packaging instructions, and shipping promise text. A closed loop between operations and merchandising is the engine of repeatable second-curve gains.
Over time, this operating model creates a proprietary learning advantage for independent sellers. Competitors can copy pricing, but they cannot easily copy the exact fulfillment data history behind your bundle logic. Each cycle improves both economic predictability and customer trust, which is critical in markets where acquisition costs remain volatile. The second curve becomes less about chasing volume and more about compounding decision quality.
FAQ
How much fulfillment data is enough to start reverse-engineering bundles?
Most independent stores can begin with eight to twelve weeks of clean fulfillment data, provided order fields are standardized and exception coding is consistent. The key is not massive volume but reliable structure, because even moderate datasets can reveal stable co-ship and friction patterns. Start small, keep definitions fixed, and expand scope as confidence increases.
How frequently should bundle logic be updated?
Weekly review cycles are usually effective for active catalogs, with deeper monthly audits for structural changes. Fast cadence helps detect emerging issues before they affect customer satisfaction at scale. Fulfillment data should guide whether changes are tactical adjustments or full bundle redesigns.
Can this method work for stores with limited staff and simple tooling?
Yes, because the method depends more on consistency than on advanced software. A disciplined spreadsheet process with clear definitions can produce actionable fulfillment data insights. Small teams often execute faster because operational and merchandising decisions sit closer together.
What is the biggest mistake sellers make when designing bundles from operations?
The biggest mistake is optimizing only for perceived upsell potential while ignoring downstream execution cost. Bundles that look attractive at checkout can underperform once packing, delivery variance, and returns are accounted for. Using fulfillment data as a non-negotiable design input keeps bundle decisions realistic and scalable.